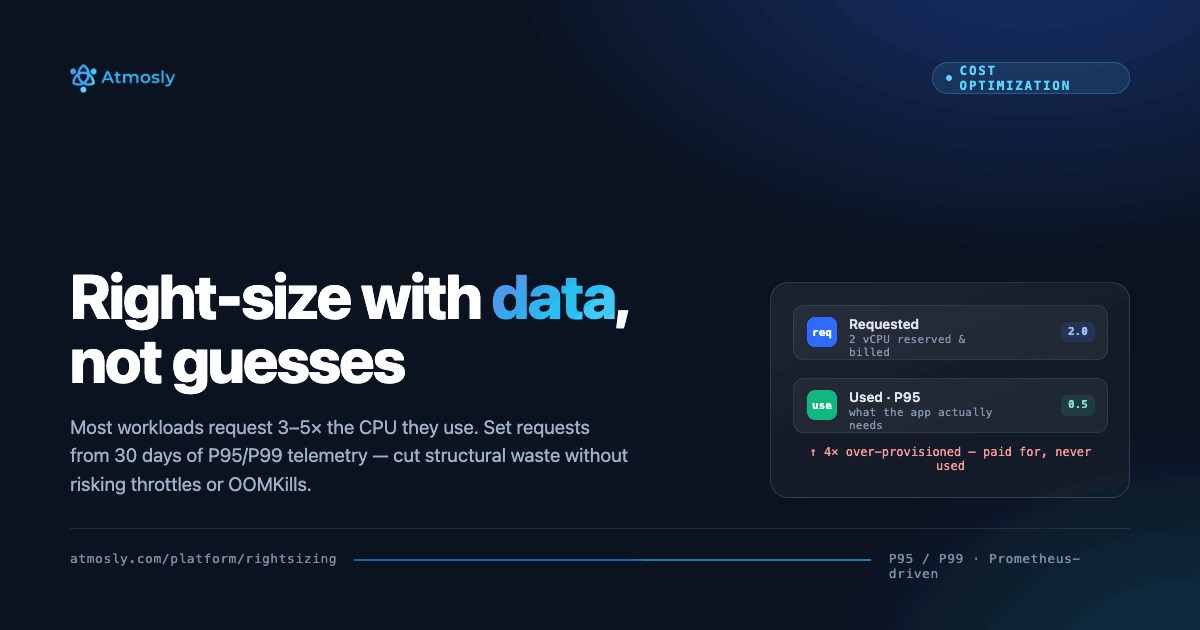
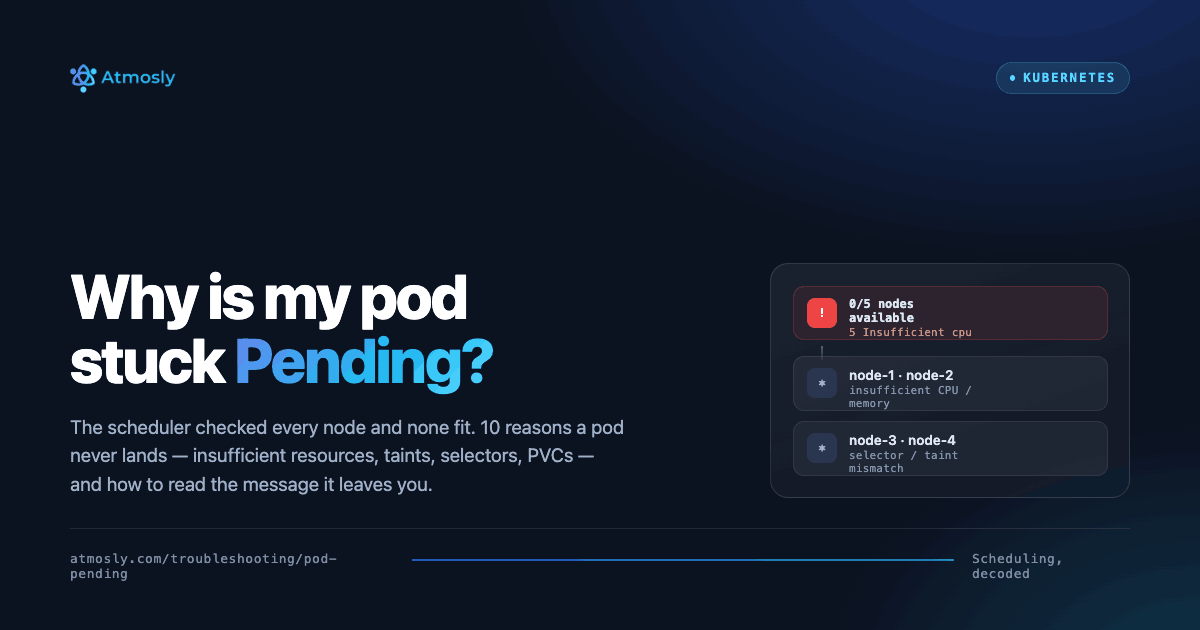
Introduction
Monitoring and observability have become mission-critical for modern DevOps teams managing Kubernetes-based applications. With microservices, distributed systems, and cloud-native architectures, gaining real-time visibility into logs, metrics, and traces is no longer optional it???s essential.
That???s where the LGTM Stack (Loki, Grafana, Tempo, and Mimir) combined with Prometheus comes in. This open-source observability stack empowers teams to collect metrics, aggregate logs, visualize performance, and trace distributed requests across every service.
In this guide, we???ll walk you step-by-step through how to set up the LGTM Stack on Kubernetes using Helm, integrate Prometheus for powerful alerting, and explore how Atmosly???s one-click deployment simplifies this entire process helping DevOps teams monitor, debug, and scale their systems effortlessly. Grafana???s LGTM (Loki, Grafana, Tempo, Mimir) along with Prometheus is a popular open-source choice among DevOps & SRE teams that streamlines end-to-end monitoring and logging empowering them to:
- Gather in-depth system metrics for real-time health analysis.
- Transform raw data into meaningful dashboards to identify trends and anomalies.
- Securely store and analyze application logs for deeper troubleshooting capabilities.
- Trace the flow of requests across applications for pinpoint performance optimization.
- Help Scale applications to meet the demands of large and complex deployments.
Prometheus
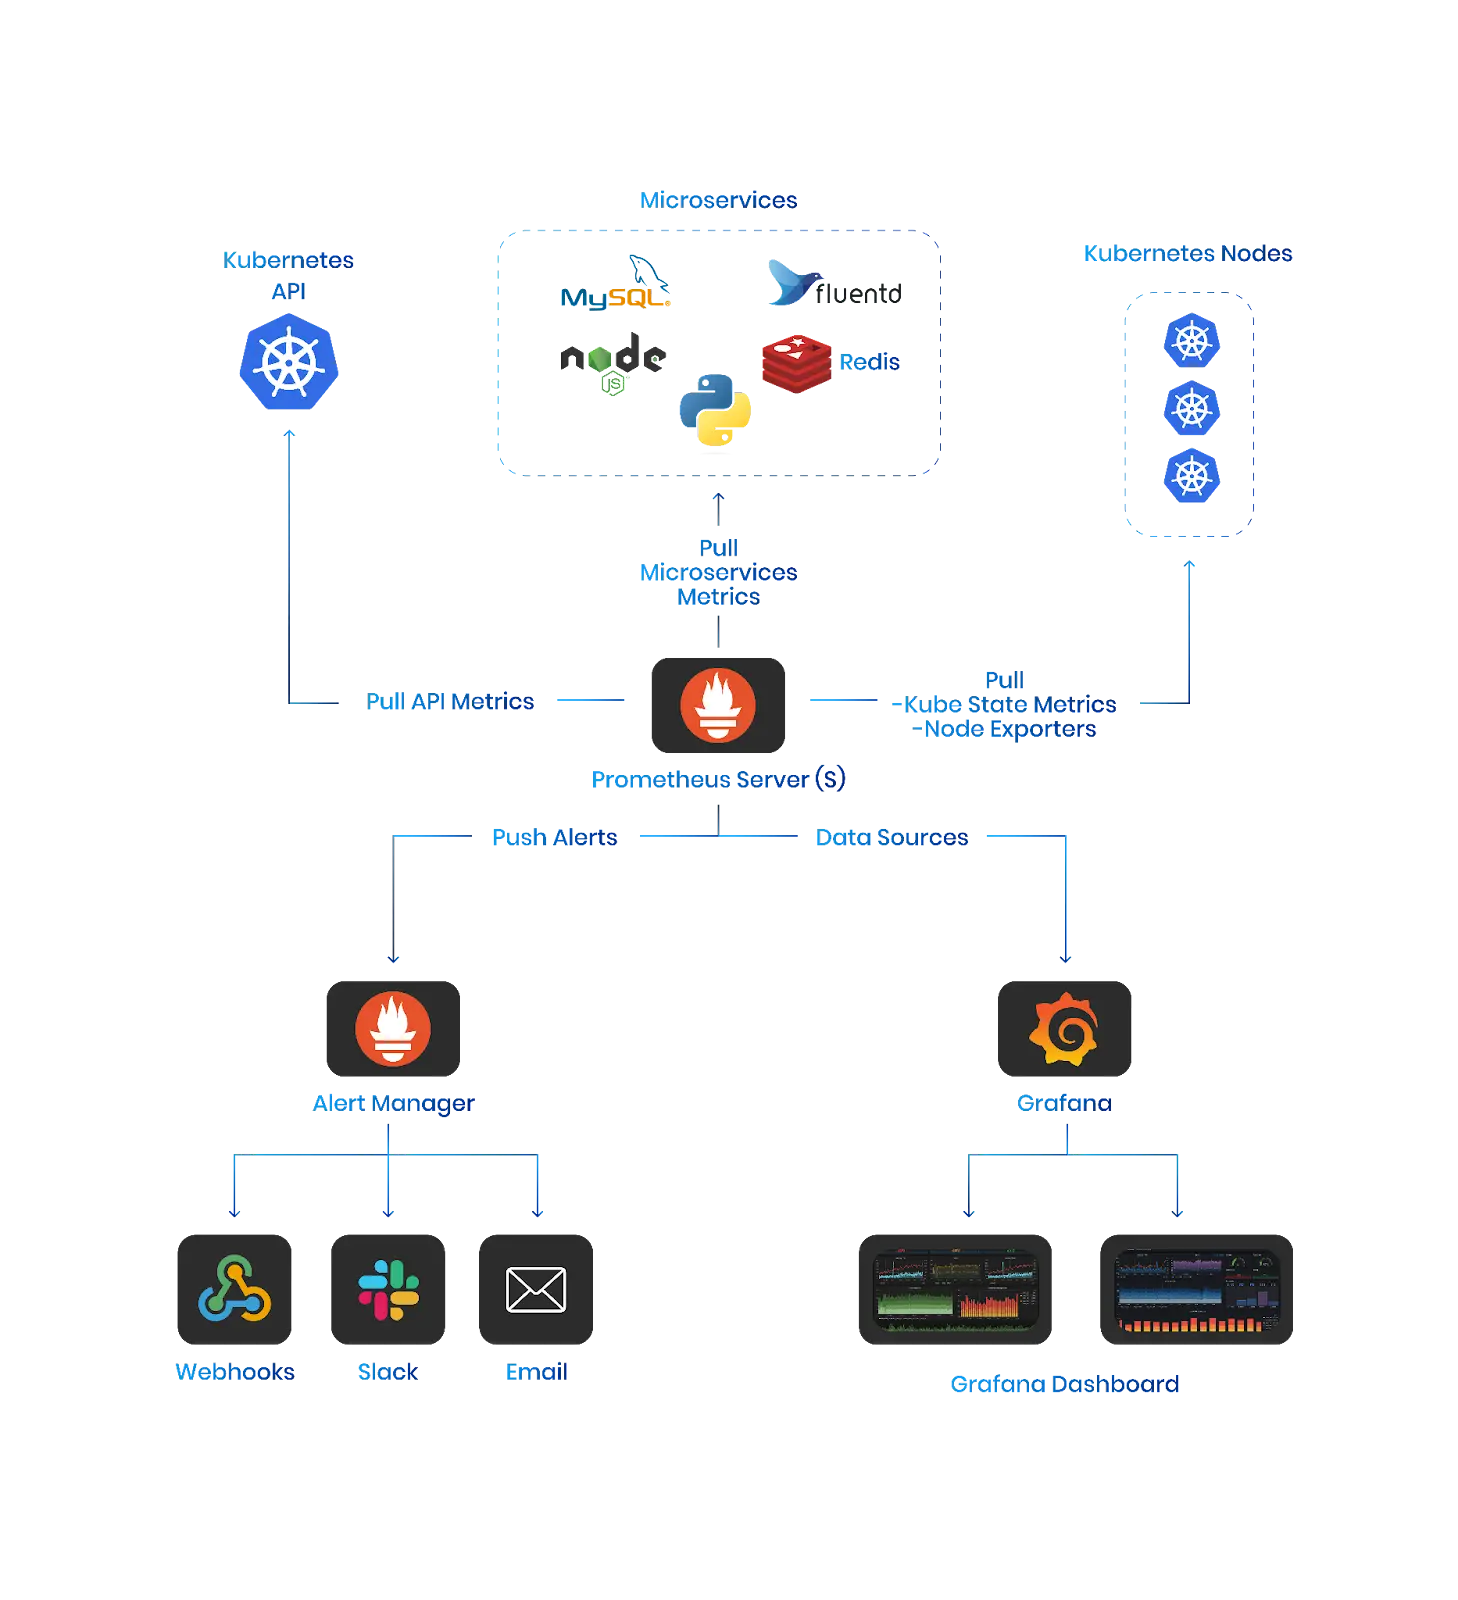
Prometheus is one of the most popular Open-source tool which exist from last decade and one of early adopters of Go language. It records metrics in a time series database built using an HTTP pull model, with flexible queries and real-time alerting. Let???s break down it???s capabilities in little depth
- Metric Ingestion: Prometheus acts as a pull-based monitoring system. It scrapes data (metrics) exposed by applications, infrastructure, and services using HTTP pull mechanisms. This lightweight approach minimizes overhead on monitored targets.
- Time Series Database: Collected metrics are stored as time series data, allowing for historical analysis and trend identification. This data is readily accessible for querying with PromQL, a powerful and expressive language specifically designed for navigating time series data.
- Alerting and Notification: Prometheus excels at proactive monitoring. Users leverage PromQL to define alerting rules based on specific metric thresholds or anomaly detection patterns. When triggered, these alerts can notify via various channels like email, SMS, or integrations with chat platforms.
Grafana
Grafana acts as a visualisation tool to convert all the raw data into more informed & meaningful data presented in different form which can be easily understood. It???s powerful features provide capabilities to build dashboards , collect data from different sources through integration and sending alerts..
Here???s where our experience at SquareOps comes in. For the past five years, Grafana has been a cornerstone of our monitoring and observability strategy. Its resourcefulness has allowed us to leverage its strengths across various projects:
- Building Custom Dashboards: We???ve tailored dashboards to each client???s specific needs, providing them with clear, actionable insights into their IT infrastructure???s health.
- Data Unification: Grafana seamlessly integrates with diverse data sources, eliminating data silos and offering a holistic view of system performance.
- Proactive Alerting: By setting up custom alerts within Grafana, we???ve ensured our clients are notified of potential issues before they snowball into major problems.
But our commitment to Grafana doesn???t stop there. We???re actively using it within Atmosly, our in-house platform. Here, Grafana plays a dual role:
- Default Functionality: Every Atmosly environment automatically benefits from pre-built Grafana dashboards, providing instant visibility into key metrics.
- Centralized Monitoring: Atmosly acts as a control plane, which helps manage the configuration and deployment of this Stack along with consolidating data from all deployed environments and providing rich dashboards. Imagine the power of having a single pane of glass for monitoring your all environment???s.
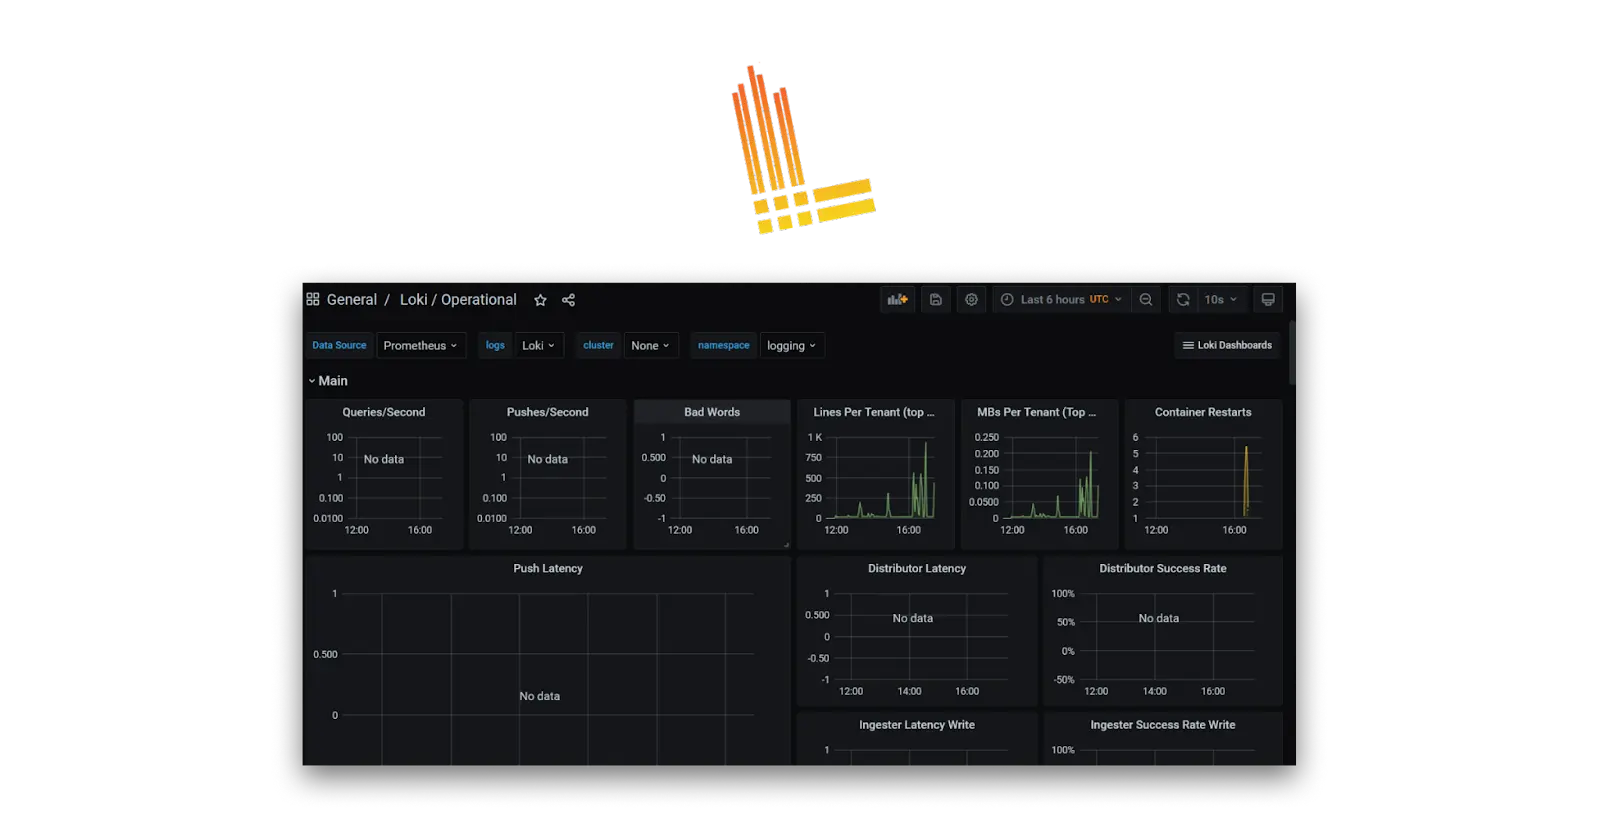
Loki
Loki is a log aggregation system which store and query logs from your applications and infrastructure which can be visualised on Grafana dashboard. Loki is different from other logging tools in a way that it does not index messages but labels them and store only the metadata for each messages.
This innovative approach offers several key advantages:
- Cost-Effectiveness: By storing lightweight metadata instead of full logs, Loki significantly reduces storage requirements, making it a cost-effective solution for large-scale deployments.
- Scalability: Loki???s architecture allows it to scale horizontally with ease. As your log volume grows, you can simply add more servers to handle the increased load.
- Faster Queries: Since Loki focuses on labels and metadata, querying logs becomes a much faster process compared to traditional full-text indexing methods. This allows to quickly pinpoint the information required.
However, Loki???s approach also comes with some limitations:
- Limited Full-Text Search: While Loki excels at searching based on labels, searching within the actual log message content itself is less efficient.
- Learning Curve: Loki???s query language (LogQL) requires some familiarity to use effectively. Fortunately, its syntax is similar to Prometheus??? PromQL, making it easier to learn for those already comfortable with that tool.

Tempo
Grafana Tempo is an open source, easy-to-use, and high-scale distributed tracing backend. Firstly what is Distributed tracing & why is this required ?
Applications built today are becoming complex and smaller each serving it???s own purpose and together they form a complete ecosystem of a product and this is called Microservice architecture. Microservice architectures, while offering scalability and modularity, introduce a new layer of complexity. Traditional debugging methods become inefficient when dealing with multiple services interacting asynchronously.
Imagine a user requesting a product recommendation on an e-commerce website. This request might trigger interactions with multiple microservices ??? one to fetch user data, another to access product information, and yet another to recommend products based on the user???s preferences. Distributed tracing helps visualize this entire flow, pinpointing exactly where each service is involved and how long it takes to respond.
Why Grafana Tempo
- Ease of Use: Tempo is straightforward to set up and integrate with existing infrastructure.
- Scalability: It???s built to handle large volumes of trace data generated by high-traffic microservice applications.
- Deep Integration: Tempo integrates seamlessly with Grafana, allowing you to visualize trace data alongside metrics and logs for a unified view of your system???s health.

Mimir
Mimir is an open-source system designed specifically for long-term storage of Prometheus data. As discussed above Prometheus is a time-series database which uses pull-based model to scrapes metrics from the target systems at regular intervals.
Prometheus only scale vertically is not efficient for large system where there is huge amount of data and also needs to be stored for longer period of time. Mimir solves this by providing a scalable storage that keeps monitoring data safe and accessible for extended periods.

Mimir Key Concepts:
- Metrics: This includes server metrics , application performance metrics or sensor data from IOT devices
- Long-term Storage: Mimir was designed to store the long term data collected by Prometheus very efficiently to analyze and query the data over longer period of time.
- Microservices Architecture: Mimir was designed to be horizontally scalable based on the concepts of Microservice architecture. This provides the flexibility of each service working independently and also scalable.
- High Availability and Multi-tenancy: Mimir is designed to be highly available, meaning minimal downtime and constant access to data.
How to Deploy ?
Deployment of entire stack can be configured in different ways depending upon the organisation requirement. We???ll explore containerized deployment using Kubernetes and Helm charts, assuming some familiarity with these technologies.
Prerequisites:
- Functional Kubernetes Cluster: Ensure you have a running Kubernetes cluster with kubectl configured for access.
- Helm: Install Helm, a package manager for Kubernetes, following the official guide for your operating system Helm | Installing Helm
If you want to Deploy the Entire LGTM stack then please use lgtm-distributed-1.0.0 release from the Grafana helm chart library released lgtm-distributed-1.0.0 -? grafana/helm-charts which will install distributed Loki, Grafana, Tempo and Mimir stack. Promethous will need to be setup independently as defined below Deployment with Individual Helm Charts ?
1. Identify Helm Charts: it???s official Helm charts for each tool
- Prometheus: https://github.com/prometheus-operator/prometheus-operator
- Grafana: https://github.com/grafana/helm-charts
- Loki: https://grafana.com/docs/loki/latest/setup/install/helm/
- Tempo: https://grafana.com/docs/tempo/latest/setup/helm-chart/
- Mimir (Optional): https://grafana.com/oss/mimir/
2. Install Base Components: Start by deploying the foundational components:
- Prometheus: Deploy Prometheus using its Helm chart, defining necessary configurations for scrape targets and exporters within the values.yaml file.
- Grafana: Deploy Grafana with the Helm chart, customizing configurations like data sources and user authentication within the values.yaml file.
3. Adding Loki and Tempo:
- Follow the same approach for Loki and Tempo, deploying them with their respective Helm charts and configuring data persistence, resource allocation, and any additional options in the values.yaml files.
4. Mimir Integration (Optional):
- If using Mimir, deploy it with the Helm chart. Mimir leverages Prometheus as a base, so ensure proper configuration for data scraping and alerting within Mimir???s values.yaml file.
5. Service Discovery and Ingress:
- Configure Kubernetes Services for each deployed component to enable communication within the cluster.
- Optionally, set up an Ingress controller to expose Grafana externally for centralized dashboard access.
Verification and Validation:
- Once deployed, verify pod health using kubectl get pods.
- Access Grafana using the configured Ingress URL (if applicable) and explore initial dashboards.
- Configure data sources within Grafana to connect with Prometheus, Loki, and Tempo for detailed monitoring and tracing visualisations.
How Atmosly Leverages This Stack for Customer Success
At Atmosly, we understand the critical role of comprehensive monitoring and logging. That???s why we???ve built our entire monitoring and logging infrastructure using the very tools described above. We leverage this powerful stack extensively to debug any issues within our own infrastructure, ensuring a smooth and reliable experience for our customers.
But Atmosly takes it a step further. We provide this same end-to-end monitoring and logging pipeline as a single-click deployment for all clusters created across our clients??? environments.
This translates to several advantages for developers deploying applications through Atmosly:
- One-Click Setup: The monitoring and logging stack is seamlessly integrated as part of our Cluster Add-ons. With a single click, the entire stack gets deployed and exposed over a secure URL, eliminating complex manual configurations.
- Default Dashboards: Out-of-the-box, your Grafana instance comes pre-configured with popular dashboards. These dashboards are specifically designed to aid in debugging issues across your cluster and environment, streamlining the troubleshooting process.
- Scaling for Growth: As your infrastructure and application complexity increase, Atmosly???s monitoring and logging solution automatically scales to accommodate the growing load. You don???t have to worry about managing infrastructure or capacity limitations.
- Continuous Improvements: The monitoring and logging tools mentioned here are constantly evolving to offer better functionality and features. Atmosly takes care of these updates and improvements with rigorous end-to-end testing, ensuring you always benefit from the latest advancements.
By utilizing Atmosly???s single-click deployment of this proven monitoring and logging stack, you gain a significant advantage from day one. Your development teams have immediate access to powerful tools for monitoring application performance, identifying and resolving issues quickly, and ultimately delivering exceptional user experiences.
Conclusion
The combination of Prometheus, Grafana, Loki, Tempo, and Mimir delivers everything a modern DevOps team needs for comprehensive observability from metrics and logs to traces and long-term storage. By deploying the LGTM Stack on Kubernetes, you create a robust, scalable, and fully transparent view of your infrastructure and application health.
At Atmosly, we take this one step further. Our platform automates and simplifies the entire monitoring and logging process with pre-configured dashboards, secure integrations, and single-click deployment of the LGTM stack. No manual configuration, no complexity ??? just instant observability that grows with your applications.
Experience One-Click Observability with Atmosly
Deploy the complete LGTM + Prometheus Stack across your Kubernetes clusters in minutes no manual setup required.